See the market turn before the index does.
Trading Awareness lets you read the whole market — breadth, rotation, and momentum across ~12,000 US stocks — so you can spot strength and weakness building before most traders notice. (Quotes ~15 min delayed.)
No credit card required · Cancel anytime · Quotes ~15 min delayed
Built on the breadth framework popularized by StockBee, with leadership scoring inspired by Minervini and Qullamaggie.
The problem
Most traders only watch price.
Most traders only watch price. But price alone can be misleading. Without understanding market breadth, you're often making decisions with incomplete information.
Why traders use it
How it works
The signals pros watch
Built on the StockBee-style breadth method
Counting how many stocks make outsized moves over each window is the fastest read on whether momentum is expanding or drying up. We compute all of it nightly, for years of history.
Dashboard tabs
Everything you need to read the market
A live tour of the dashboard

Historical breadth · Deep dive
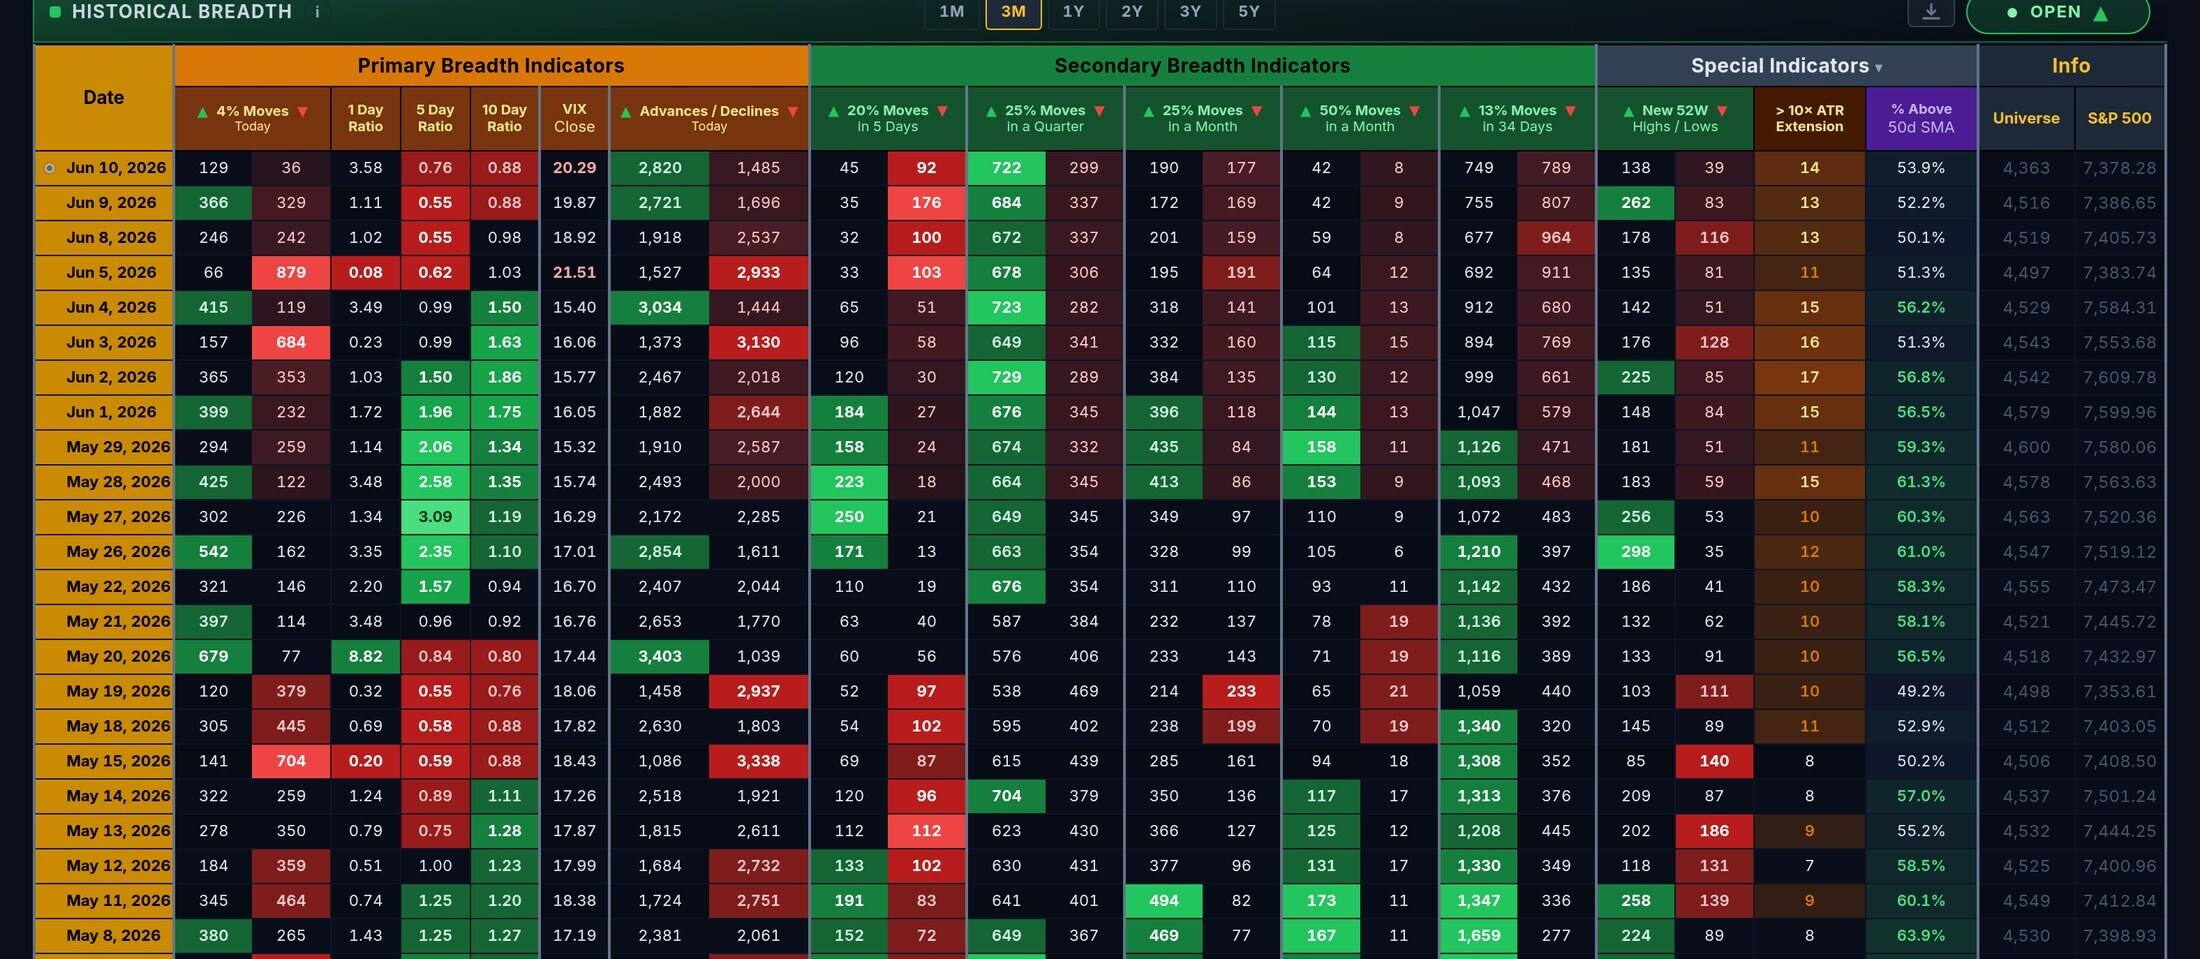
Break down every metric in the historical breadth
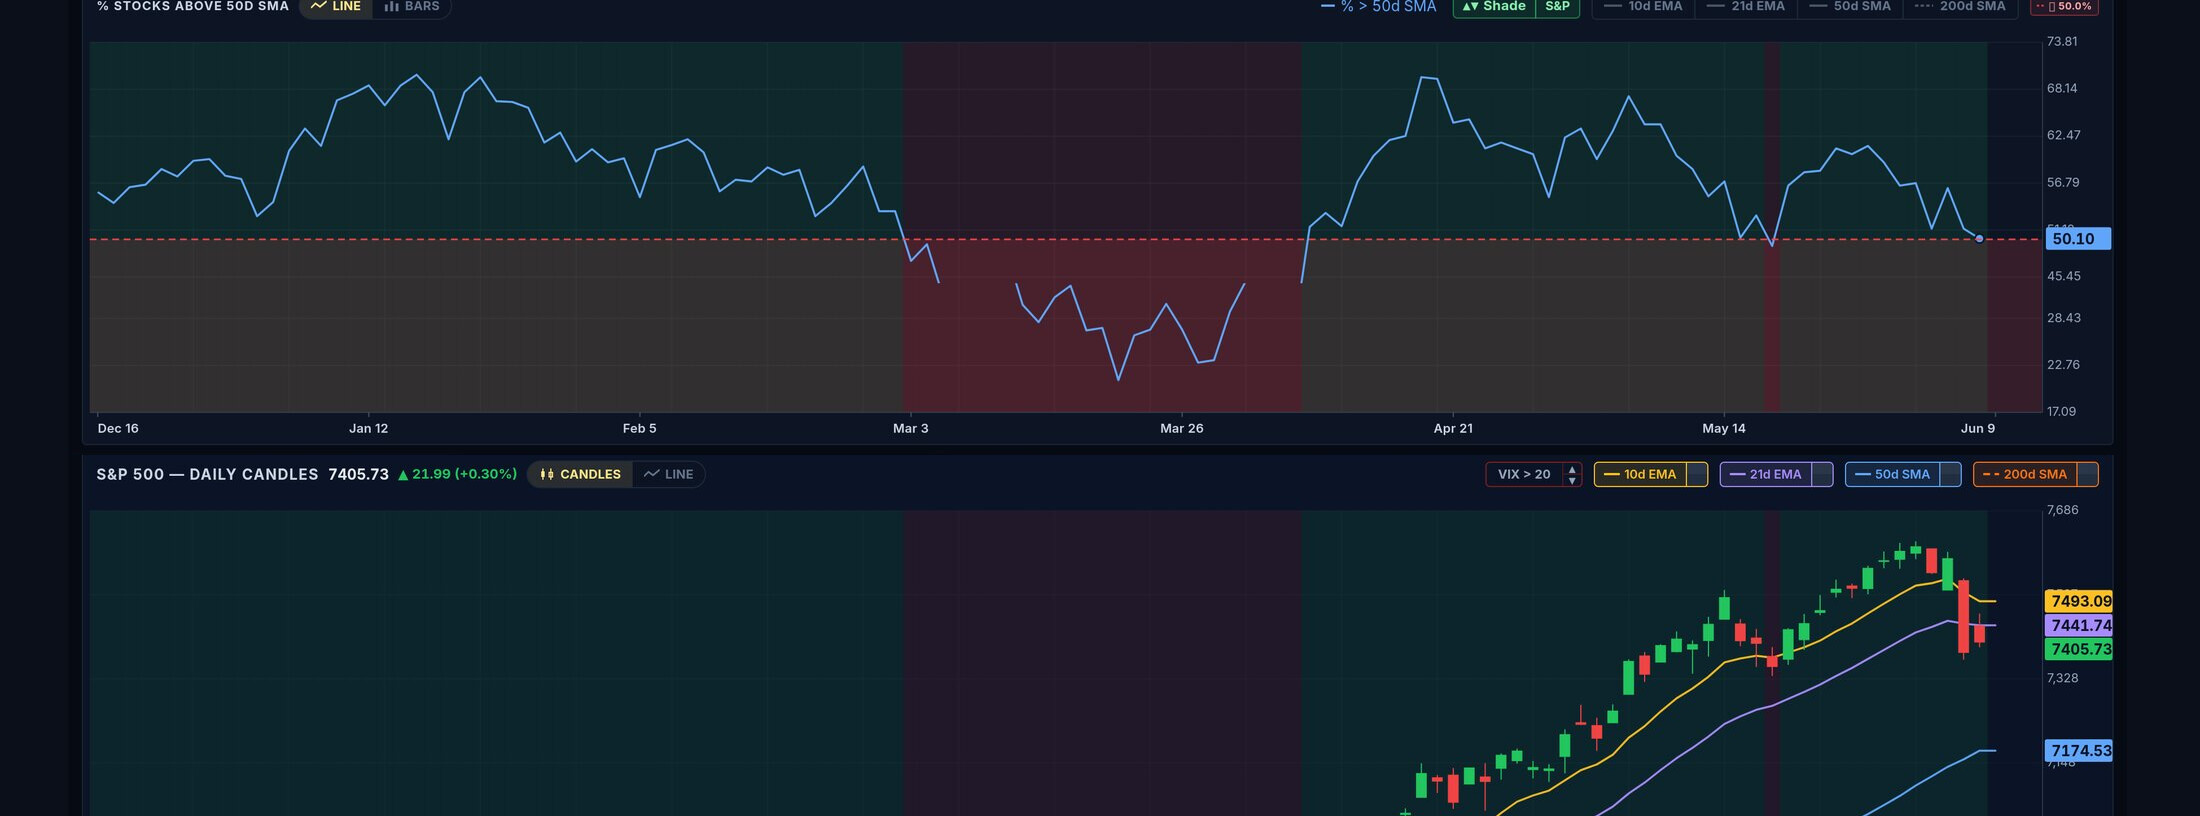
The heatmap is just the start. Click into any column — primary 4% movers, the 5/10-day ratios, % above the 50-day, 20%-in-5-days, 25%-in-a-quarter — and explode it into its own chart. Deep-dive a single signal across years, compare it against the S&P 500, and read the trend, the ratios and the regime at a glance.
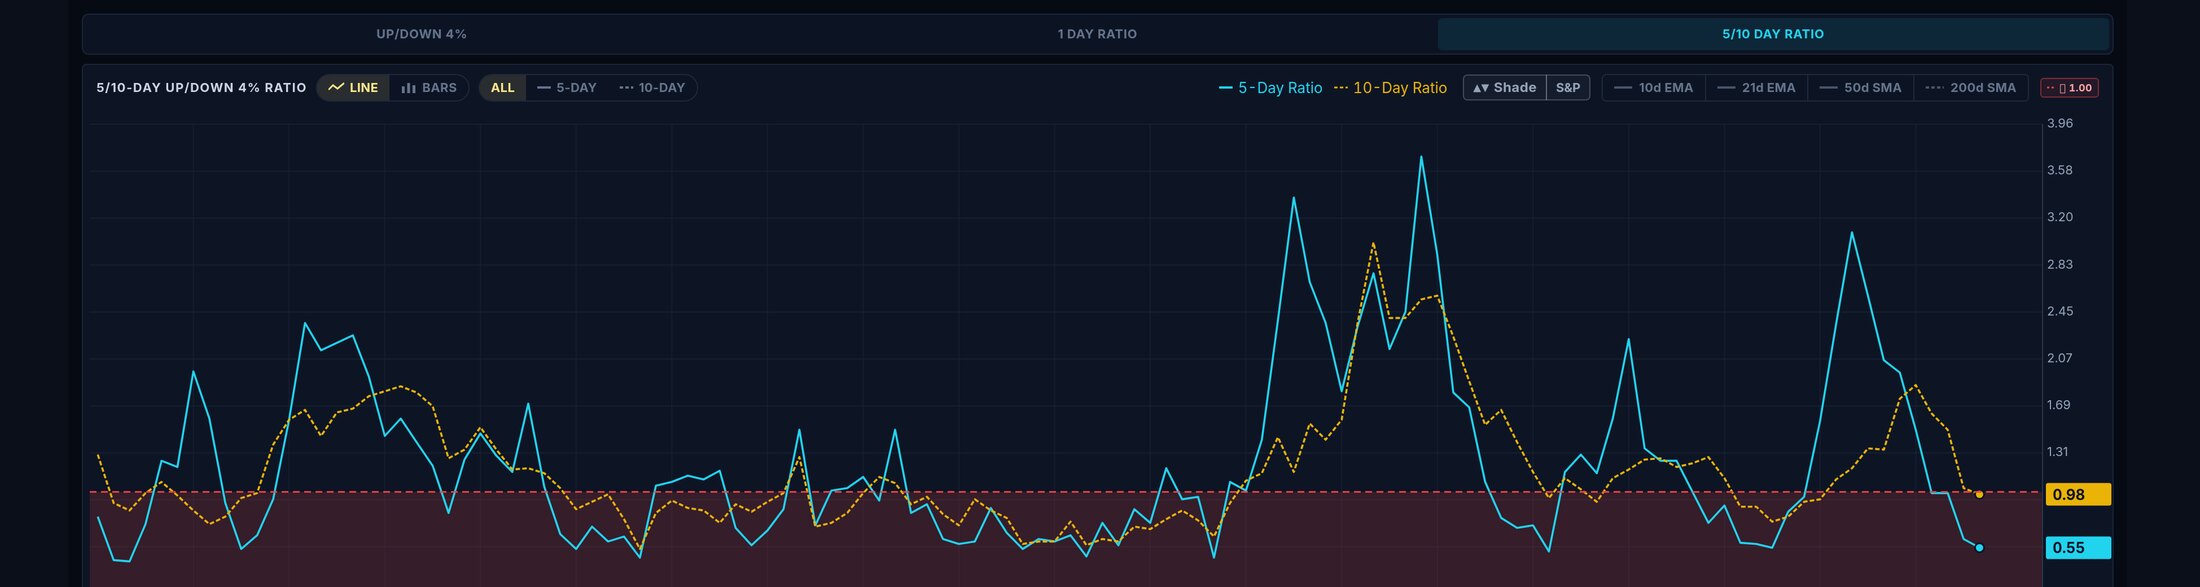
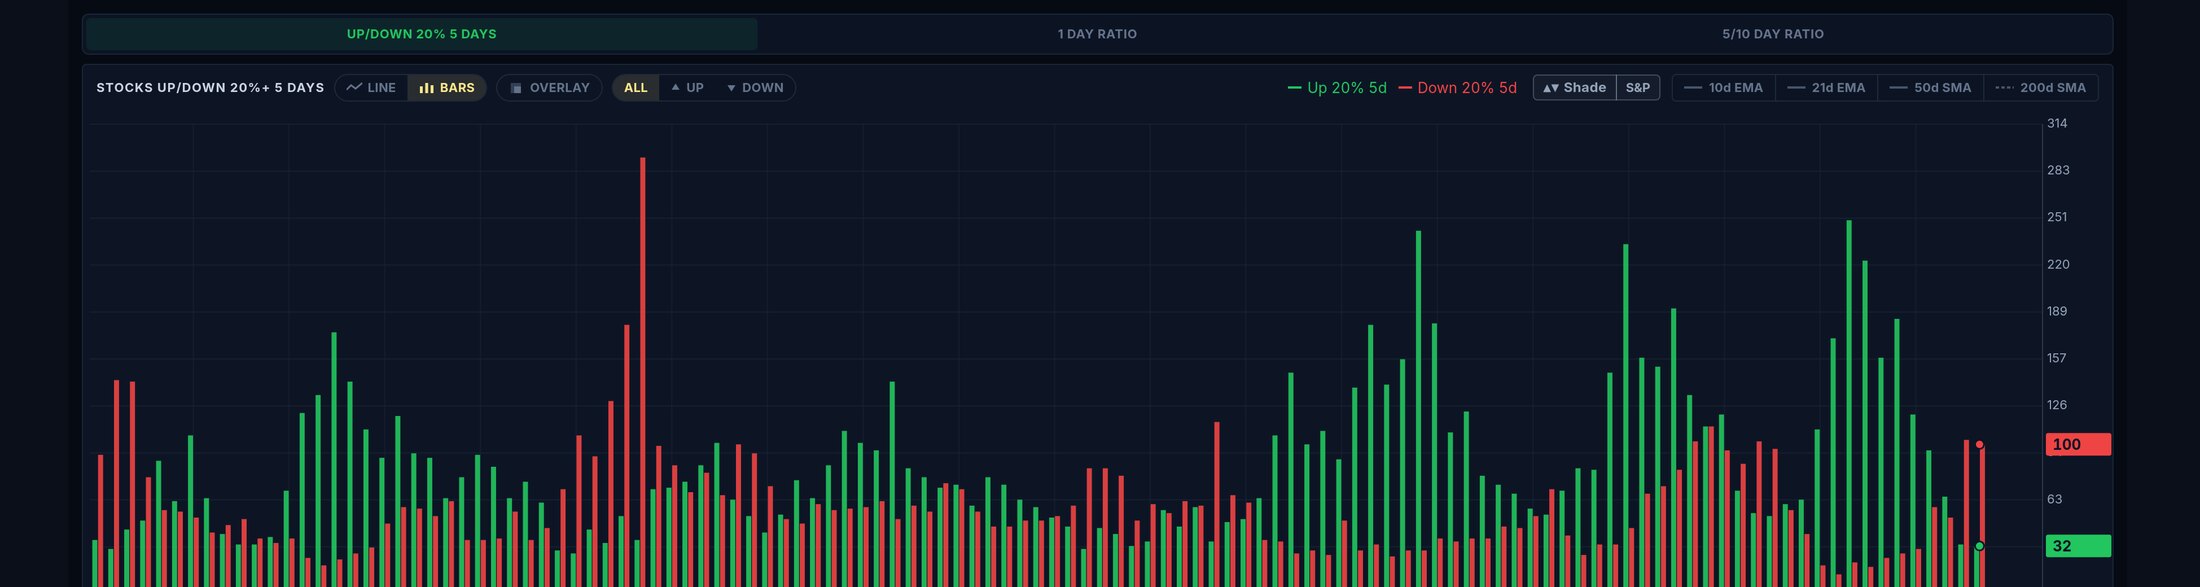
Chart any breadth signal over years
Pick any column — 20% moves in 5 days, 25% in a quarter, 50% in a month — and chart it back through 5 years of history. Overlay it on the S&P 500 to see exactly how breadth led every turn.
- Every StockBee primary & secondary column, one click away
- 5/10-day ratios, % above key moving averages, new-high/low spreads
- 20D / 40D / 60D / 120D / all-time ranges with S&P overlay
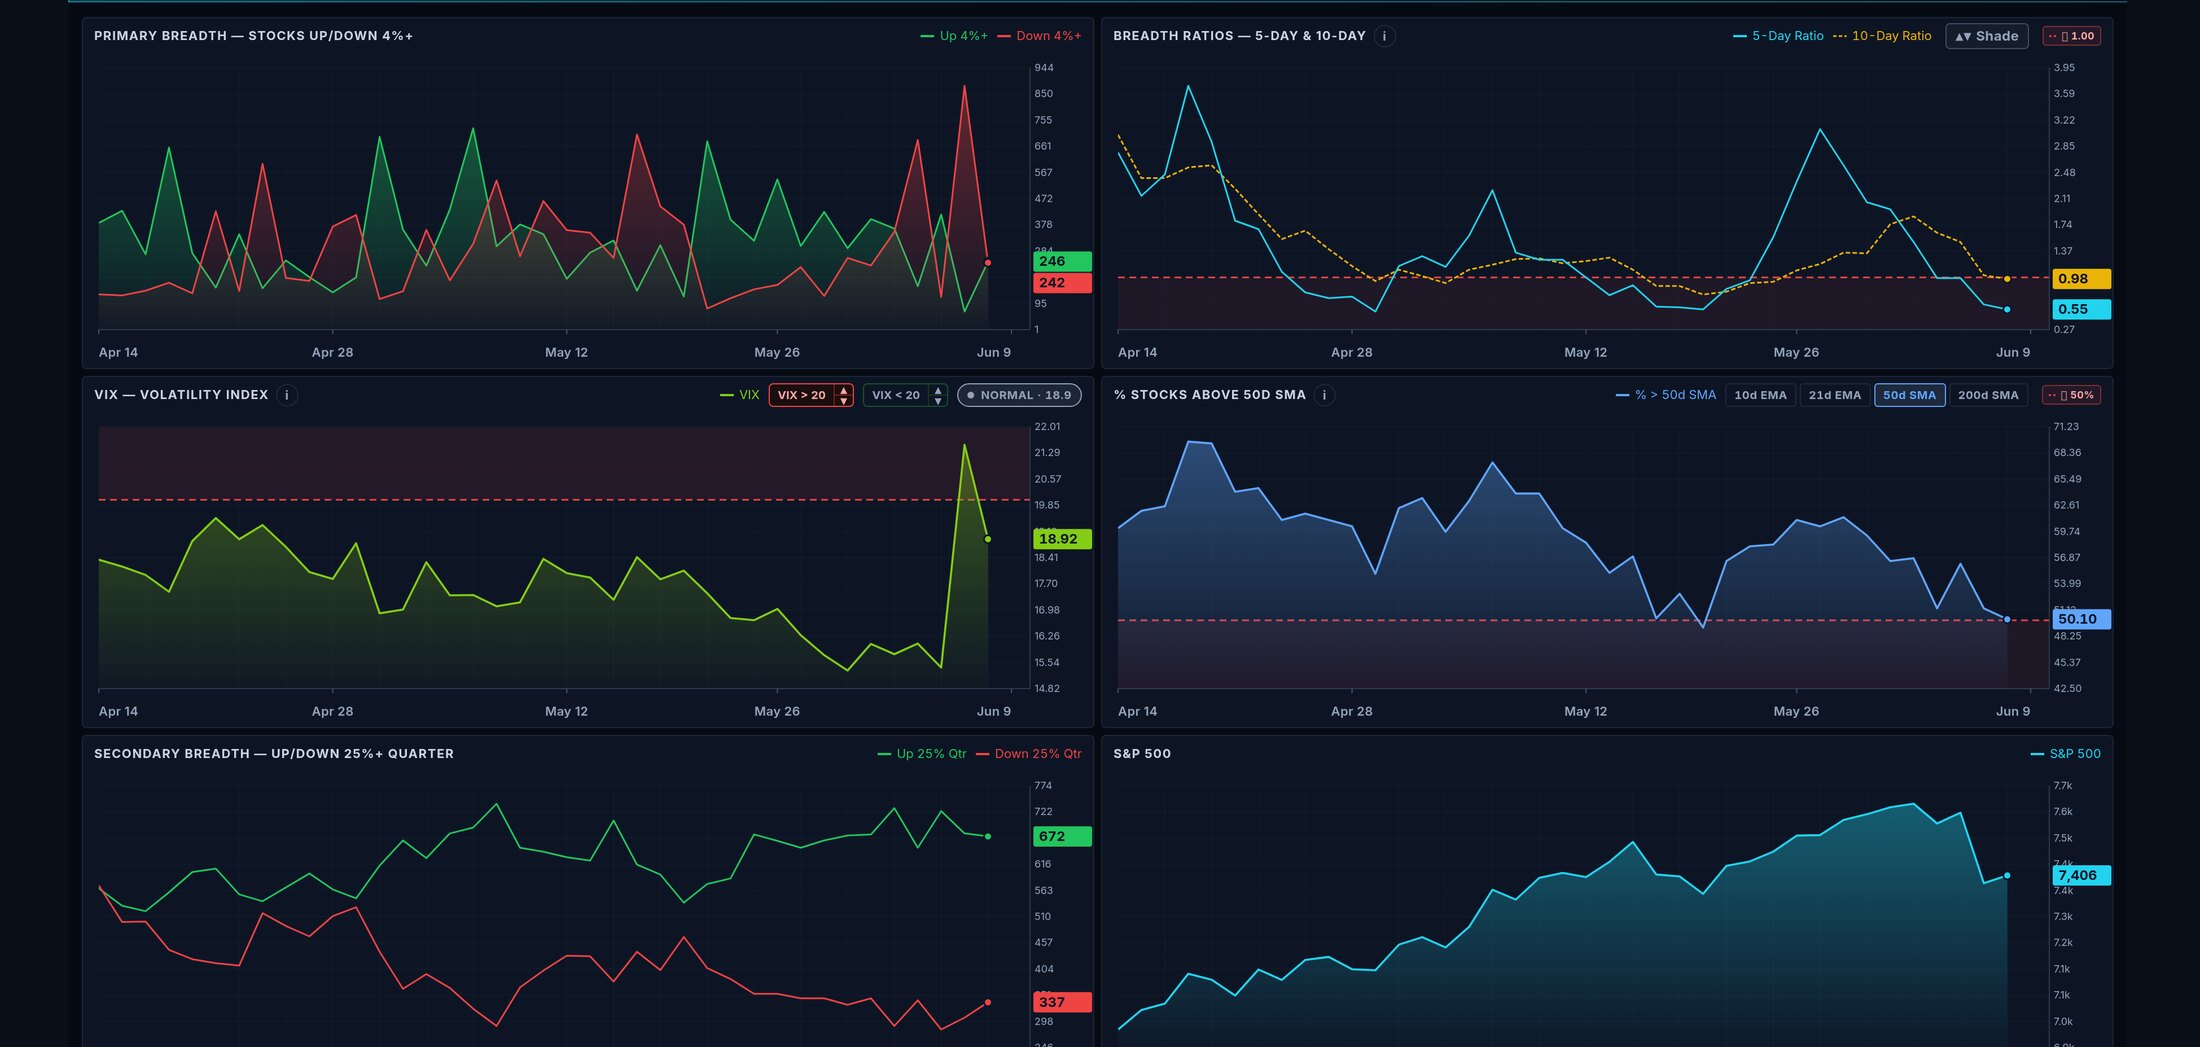
The whole tape in one glance
A live overview strip headlines every session: the S&P 500 and VIX, the share of stocks above their 21-day and 50-day averages, the 1/5/10-day up-down ratios, and how many names are up or down 4%+ today.
- Index, VIX & momentum regime read at the top of every page
- % above 21d / 50d, advancers vs decliners, new highs vs lows
- Today's 4%+ movers vs the prior day, instantly
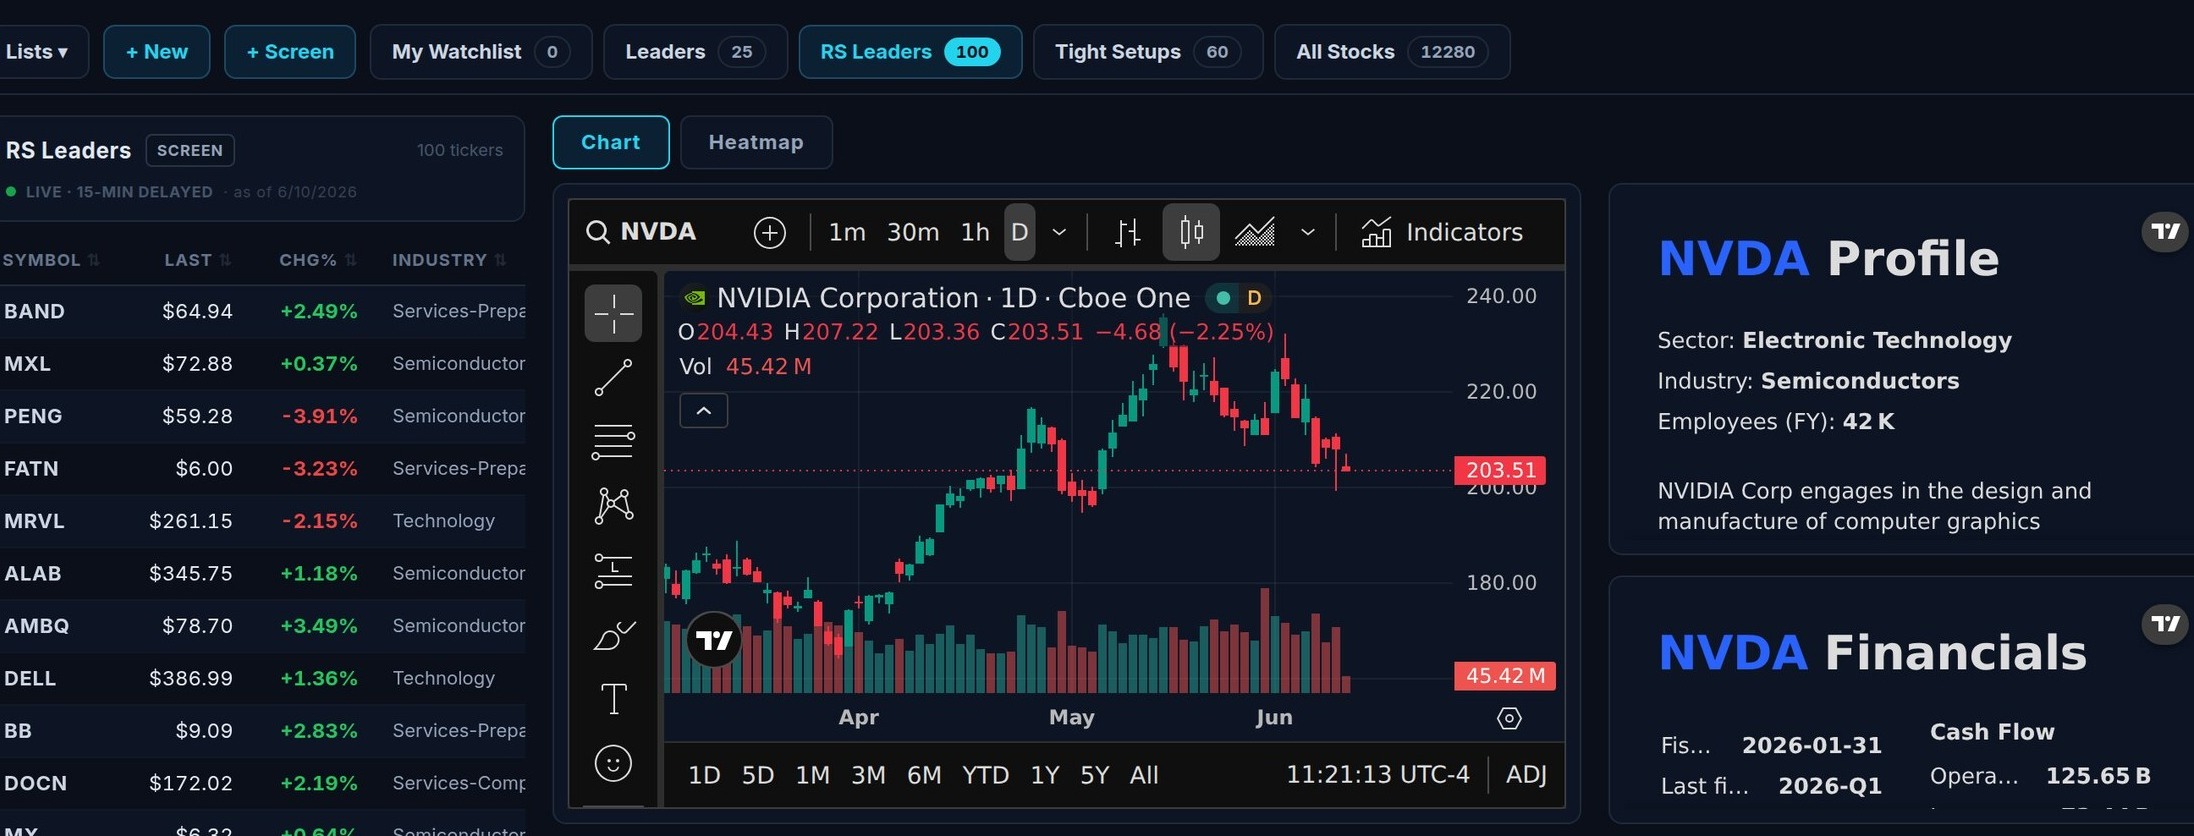
Your personal charting workstation
Build and switch between watchlists, built-in screens and themed lists, then click any ticker for a live interactive chart, company profile and financials — all on one screen.
- Sortable watchlists plus RS Leaders, Tight Setups and the full universe
- Live candlestick chart with drawing tools and indicators
- Company profile, key stats and financials beside every chart
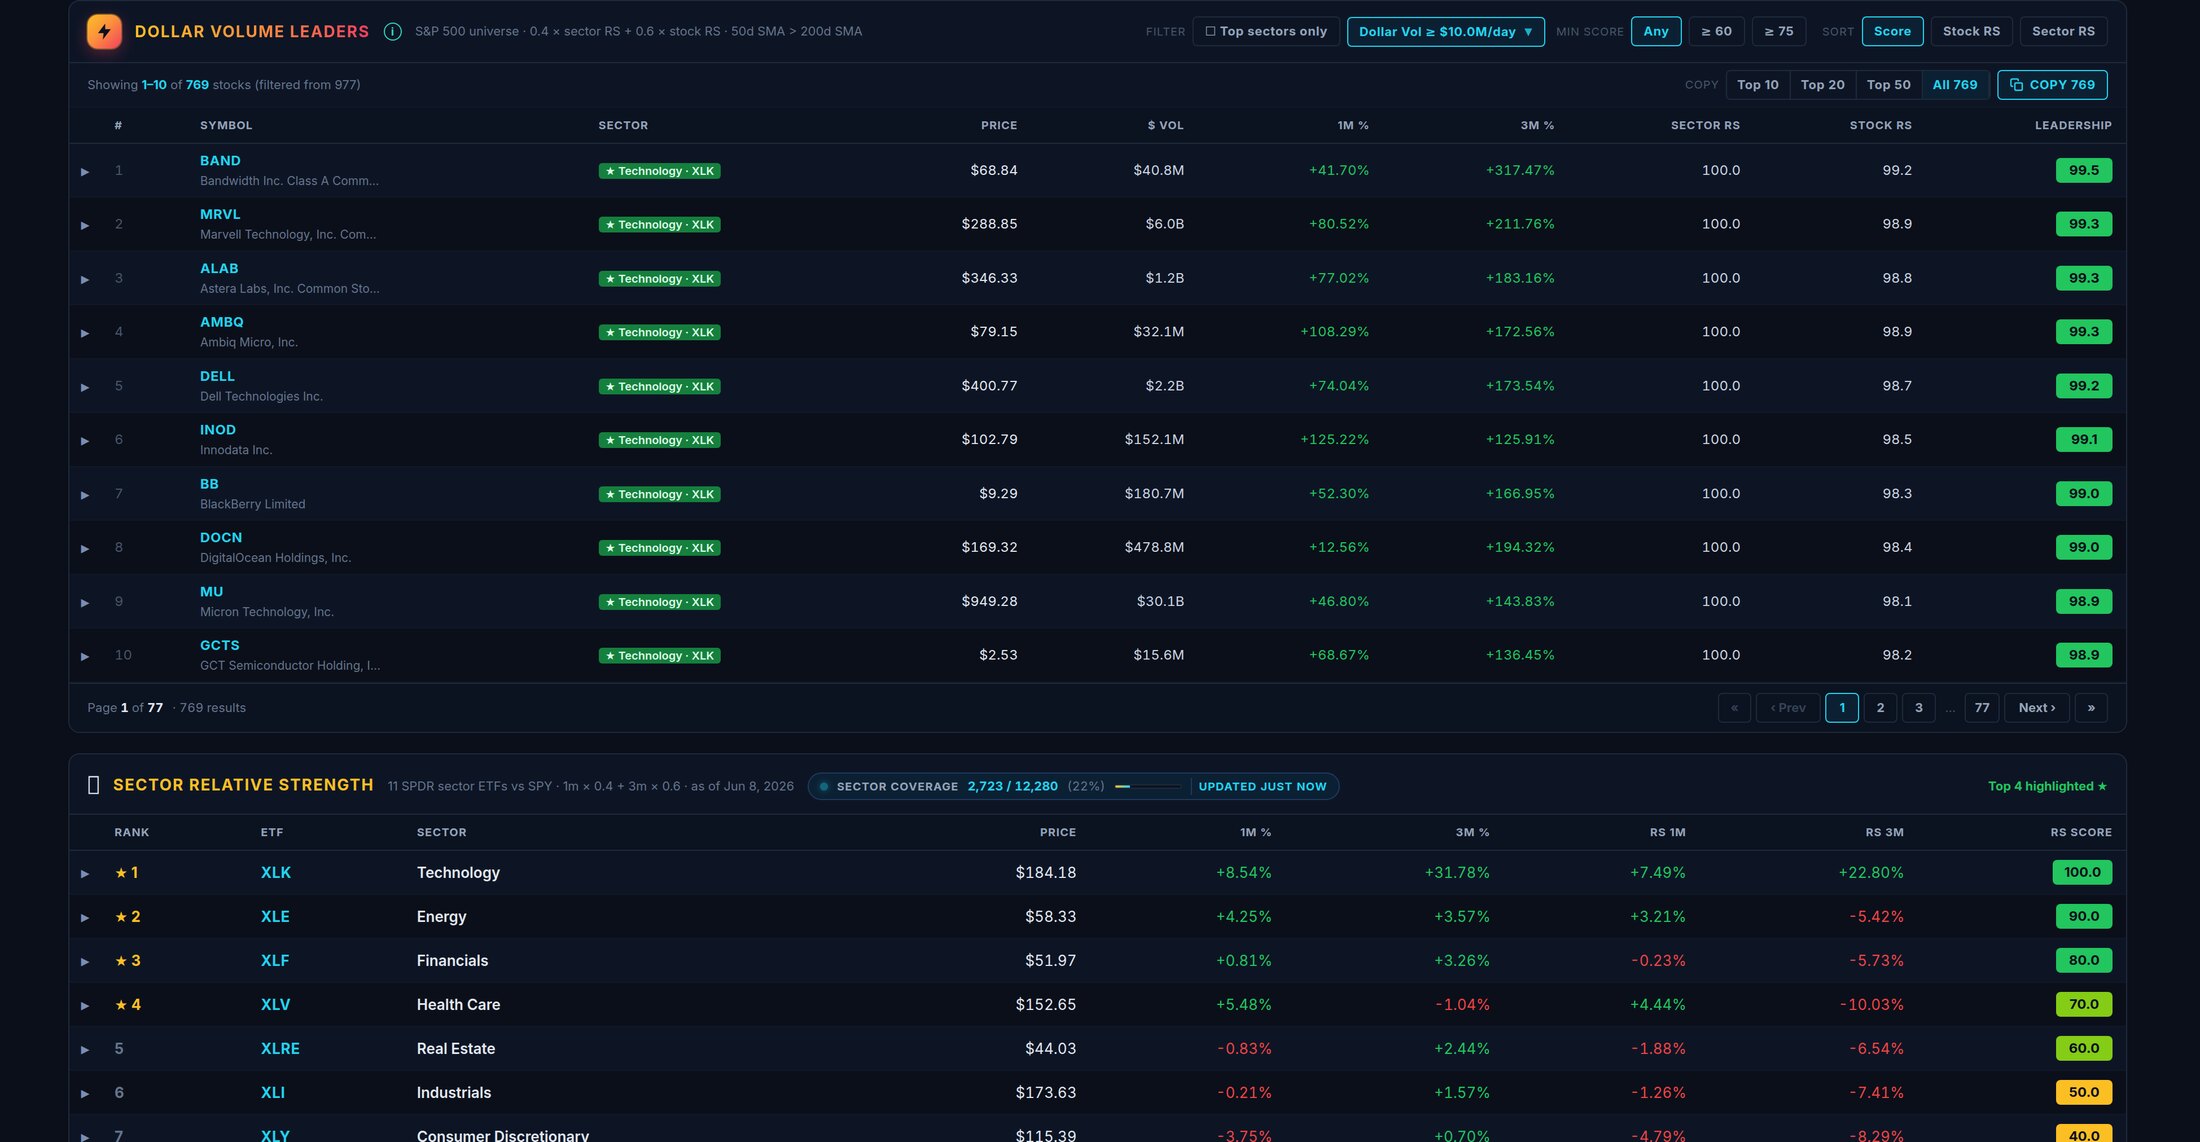
Know which sectors are actually leading
All 11 SPDR sectors ranked against SPY on a 0-100 relative-strength score, top four highlighted, plus a scored leadership list of the strongest individual stocks and the emerging names just starting to accelerate.
- 1-month × 3-month blended relative strength vs SPY
- Top-4 sectors flagged so you fish in the right pond
- Emerging Leaders surfaces accelerating RS early
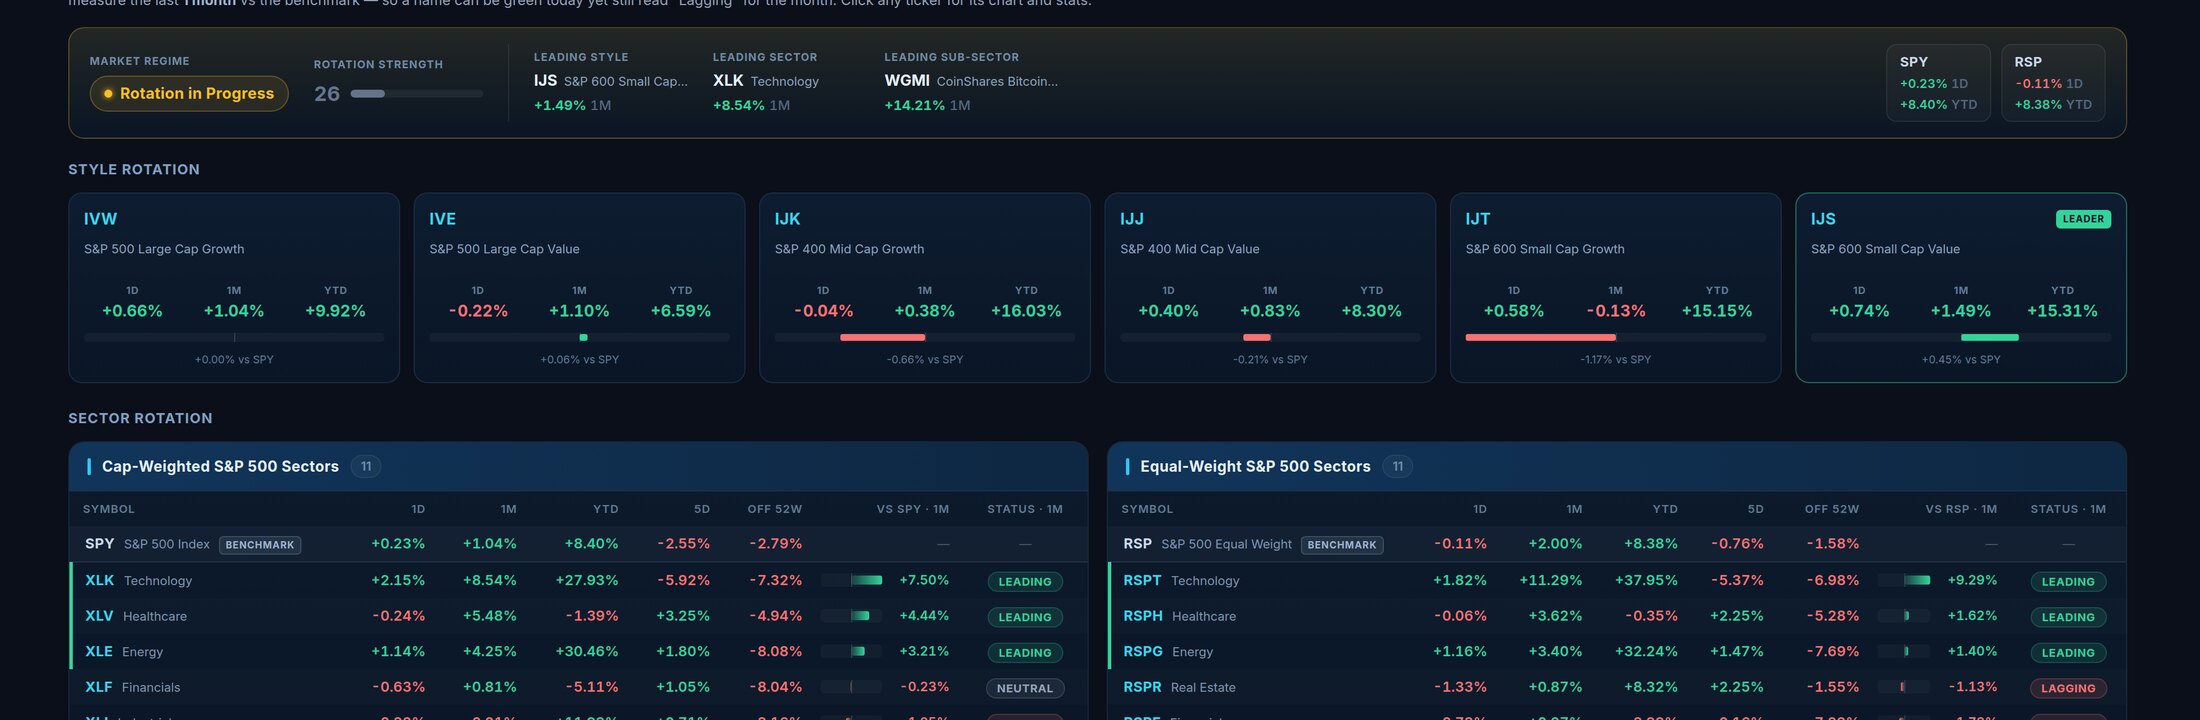
See where the money is flowing
A rotation map of style boxes, cap-weighted and equal-weight sectors, and thematic baskets — each scored 1-day, 1-month and year-to-date versus SPY, with a market-regime and rotation-strength read up top.
- Style, sector and thematic rotation in one board
- Leading style, sector and sub-sector called out for you
- Market regime + 0-100 rotation strength gauge
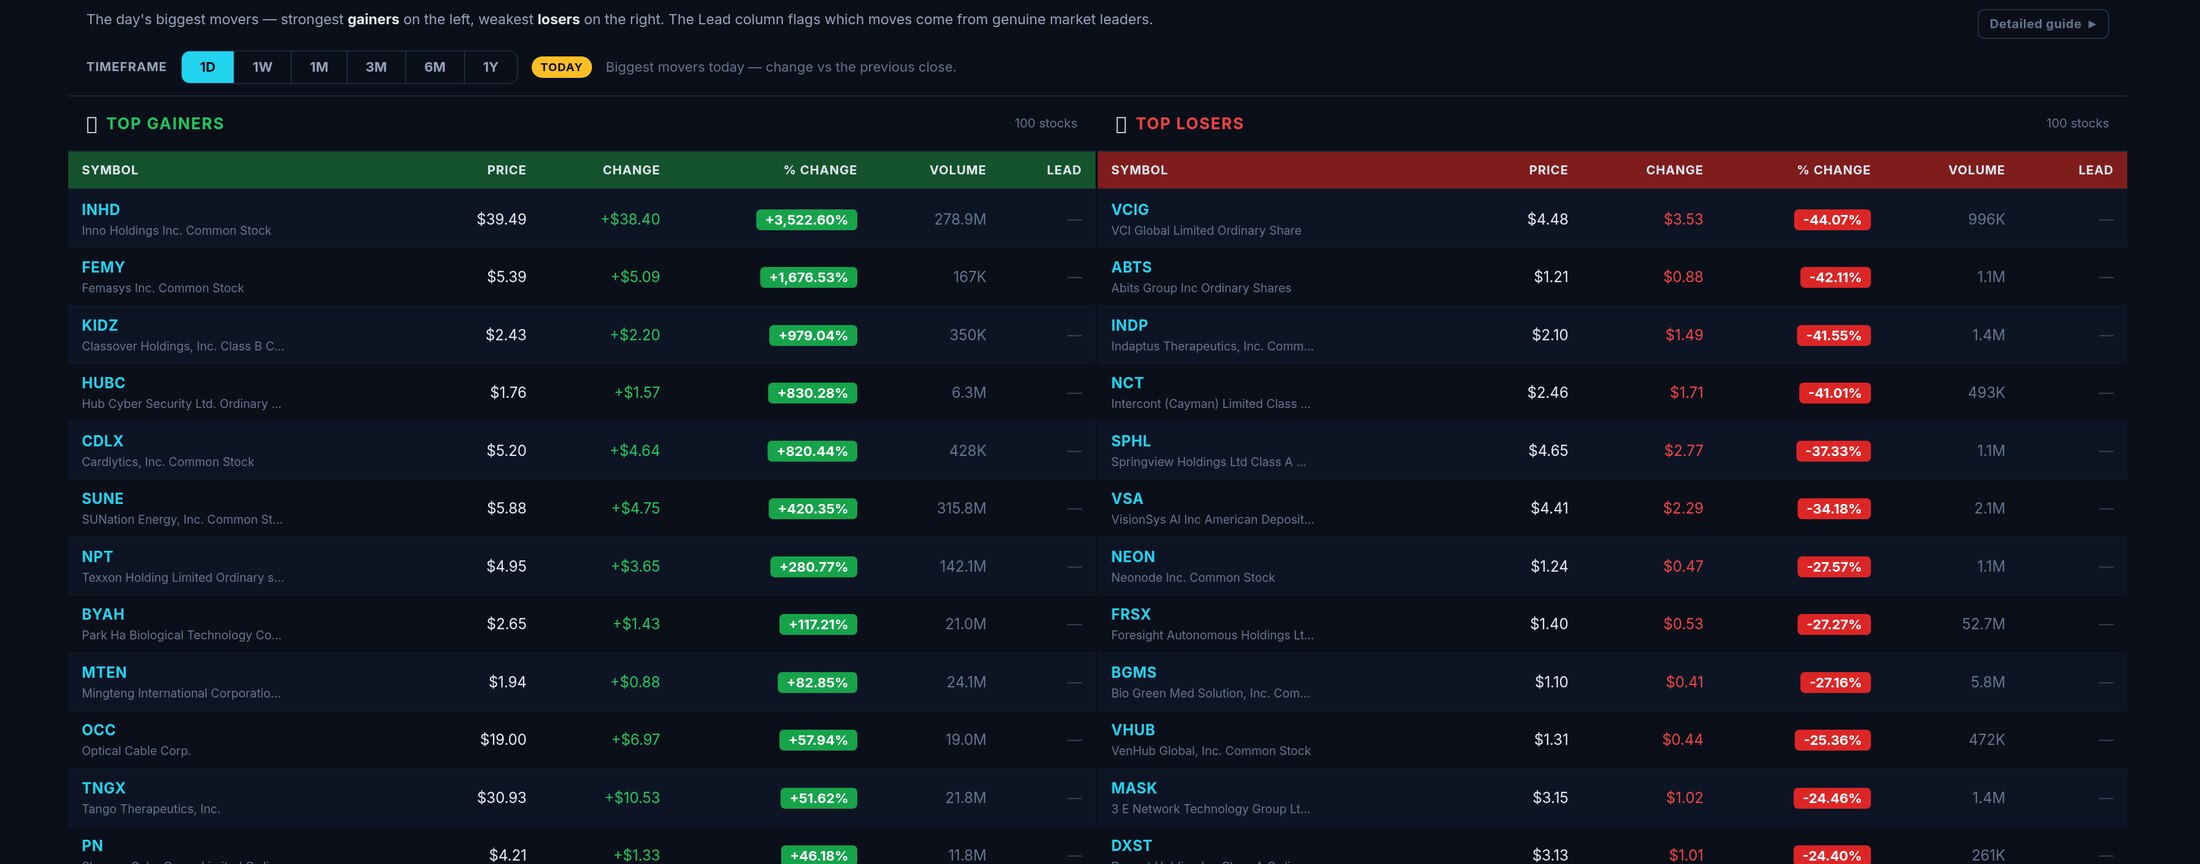
The day's movers, ranked by what matters
The top 25 gainers and losers side by side, each tagged with a leadership score so you can instantly tell a real leader breaking out from a low-quality pop — and a one-click jump to full single-stock analysis.
- Top 25 each way, by clean prior-close comparison
- Leadership score column flags genuine leaders
- Type any ticker for a buy / sell / partial verdict
Simple, transparent pricing
Start with a 14-day free trial — no charge until the trial ends.
Frequently asked questions
Is the market data live?
Quotes come exclusively from Massive.com and are delayed by roughly 15 minutes on our current data plan. Daily breadth, history and end-of-day metrics use official consolidated data.
Is there a free trial?
Yes — every new subscription starts with a 14-day free trial. You won't be charged until the trial ends, and you get full access to every tab during the trial.
Can I cancel anytime?
Absolutely. Cancel in a couple of clicks from your account billing settings. You keep Pro access until the end of the period you've already paid for.
Which markets and stocks are covered?
NYSE, NASDAQ and AMEX plus the quality OTC tiers (OTCQB / OTCQX) — about 12,000+ US common stocks in total. The breadth universe is fully configurable via your filters, with up to 5 years of daily history.
Do I need an account to try it?
Yes. A free account is required to start your 14-day trial so we can securely manage your subscription and keep your settings in sync.
How much does it cost?
One simple plan: $29.99 per month or $249 per year (save 31%). Both unlock the entire dashboard — there are no tiers or hidden add-ons.
What is trading awareness?
Trading awareness is the practice of reading the whole market — not just a handful of tickers — to understand what the environment is actually doing before you risk capital. It means combining objective breadth data (how many stocks are moving, which sectors are leading, how broad the tape is) with an honest appraisal of your own behavioral biases, so every decision is grounded in market reality rather than how the tape feels on any given day.
How does a market breadth dashboard improve trading awareness?
A breadth dashboard quantifies the market's internal health in measurable signals: how many stocks made a 4%+ move today, what share are above their 50-day moving average, which sectors are leading. When you can check those numbers every morning, your situational awareness is grounded in data rather than narrative. Trading Awareness tracks all of these signals across ~12,000 US stocks, with five years of history so you can see how today's conditions compare to every prior cycle.
From the blog
Stop guessing. Start with the data.
Join traders using Trading Awareness to spot regime shifts before the crowd.
Create your account